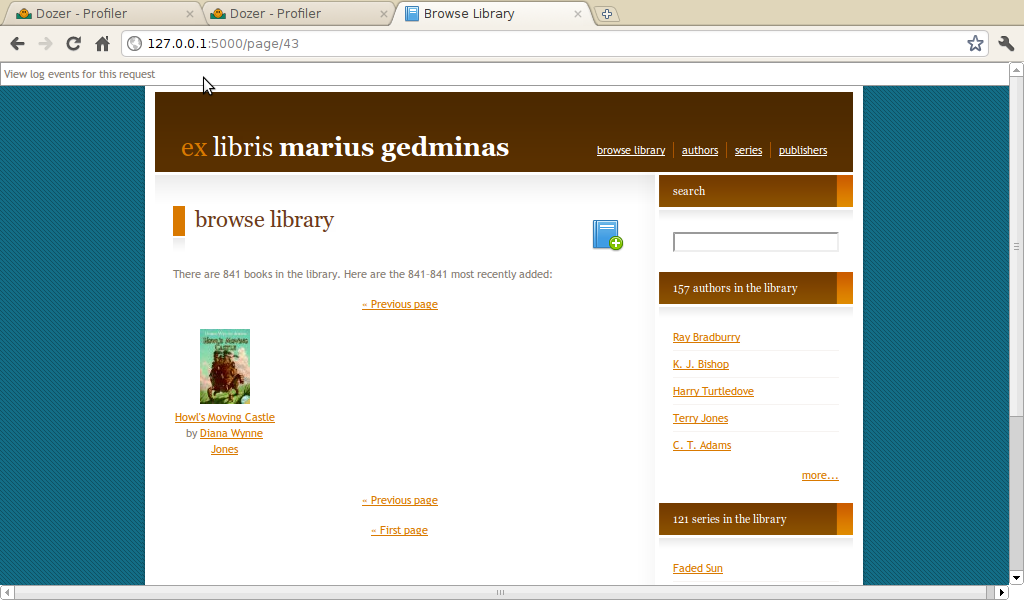
Dozer is mostly known for
its memory profiling capabilities, but the as-yet unreleased version has
more. I've talked
about log capturing, now it's time for
Profiling
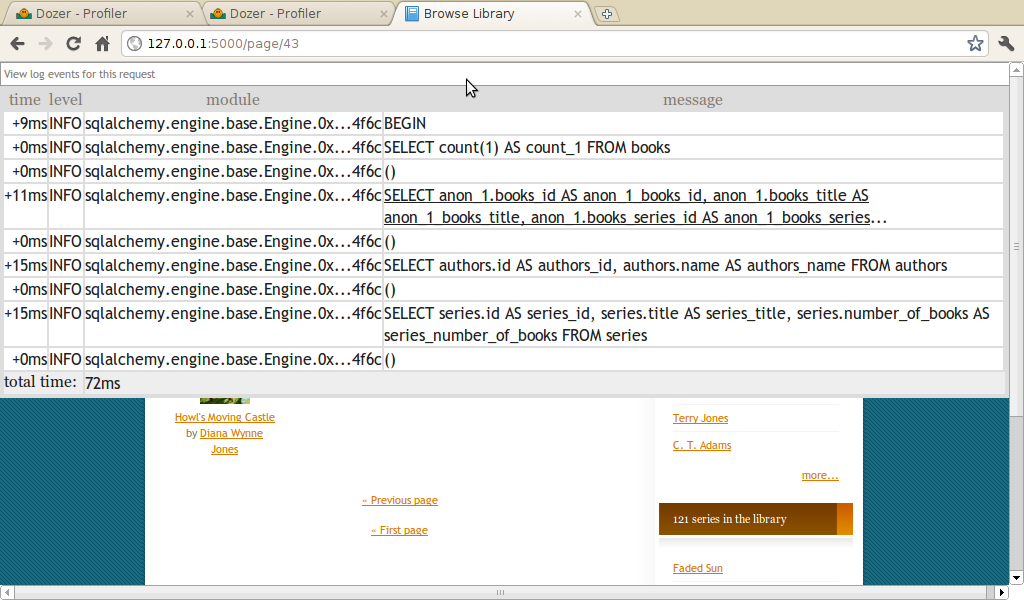
This WSGI middleware profiles every request with the cProfile module.
To see the profiles, visit a hidden URL /_profiler/showall:
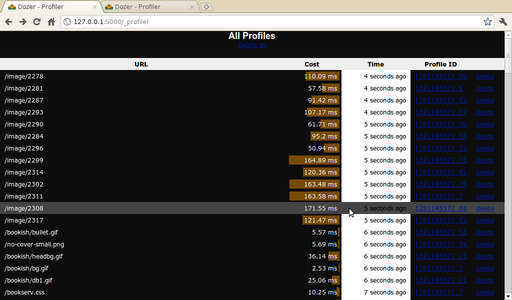
What you see here is heavily tweaked in my fork branch
of Dozer; upstream version had no Cost column and
didn't vary the background of Time by age (that
last bit helps me see clumps of requests).
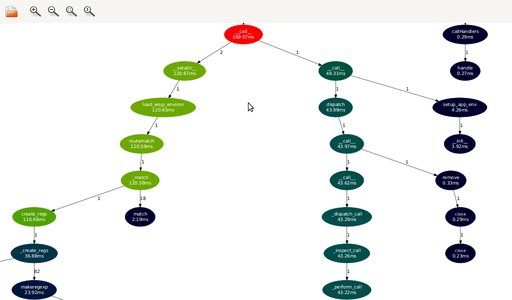
Here's what an individual profile looks like:
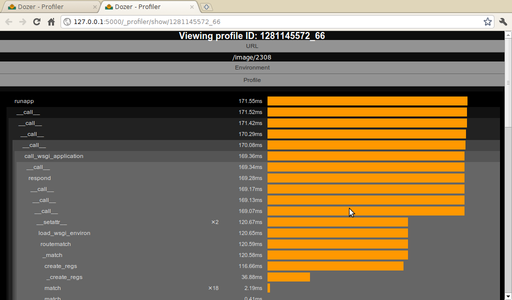
The call tree nodes can be expanded and collapsed by clicking on the
function name. There's a hardcoded limit of 20 nesting levels (upstream had a
limit of 15), sadly that appears not to be enough for practical purposes,
especially if you start profiling Zope 3 applications...
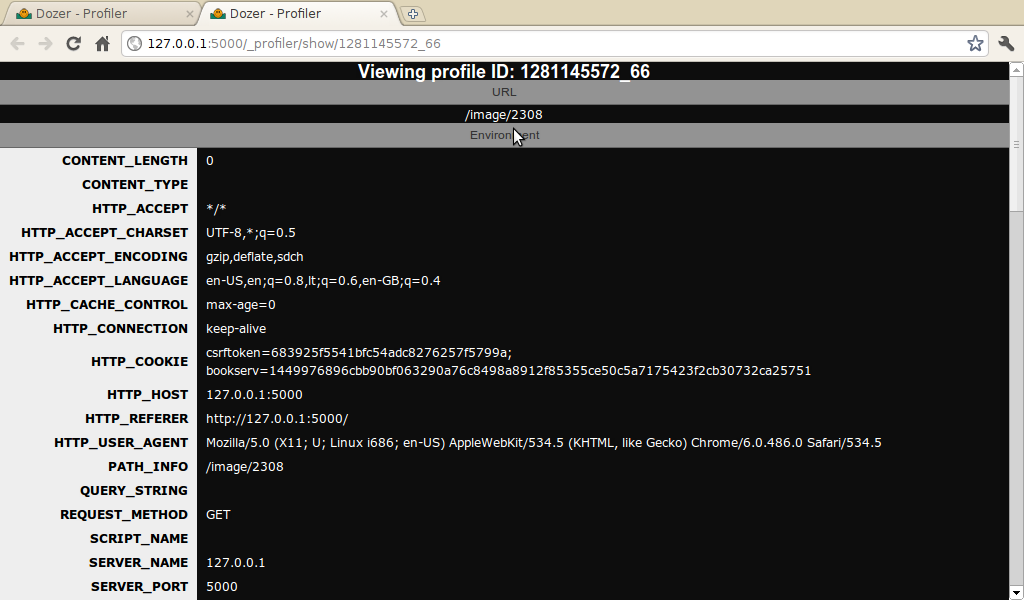
You can also take a look at the WSGI environment:

Sadly, nothing about the response is captured by Dozer. I'd've liked to
show the Content-Type and perhaps Content-Length in the profile list.
The incantation in development.ini is
[filter-app:profile]
use = egg:Dozer#profile
profile_path = /tmp/profiles
next = main
Create an empty directory /tmp/profiles and make sure other users
cannot write to it. Dozer stores captured profiles as Python
pickles, which are insecure
and allow arbitrary
command execution.
To enable the profiler, run paster like this:
$ paster serve development.ini -n profile
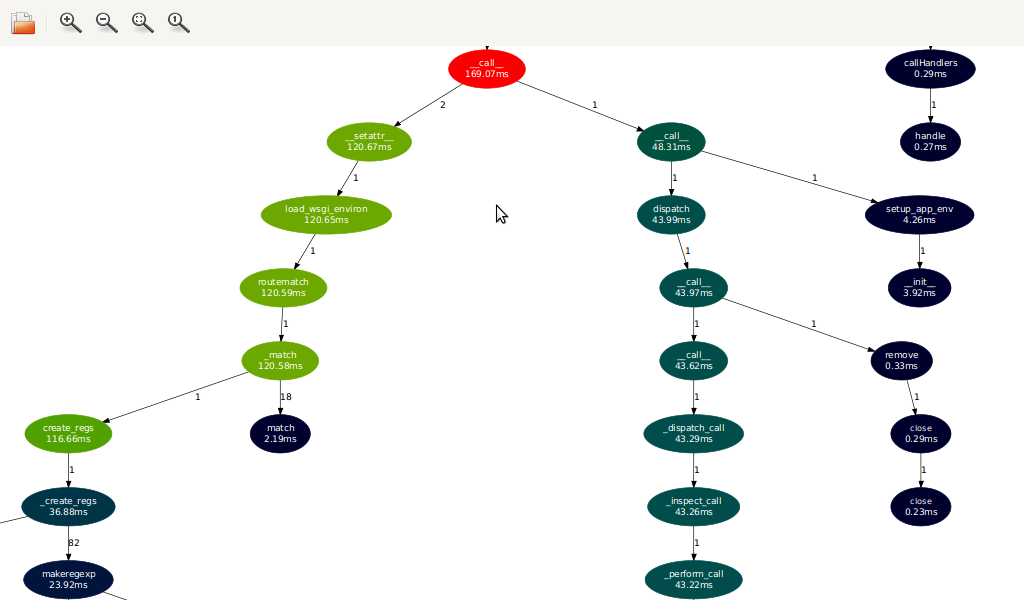
Bonus feature: call graphs
Dozer also writes a call graph in Graphviz "dot" format in the profile
directory. Here's the graph corresponding to the profile you saw earlier,
as displayed by the excellent XDot:
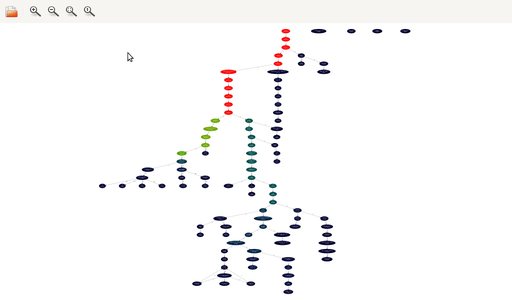
See the fork where the "hot" red path splits into two?
On the left we have Routes deciding to spend 120 ms (70% total time)
recompiling its route maps. On the right we have the actual request dispatch.
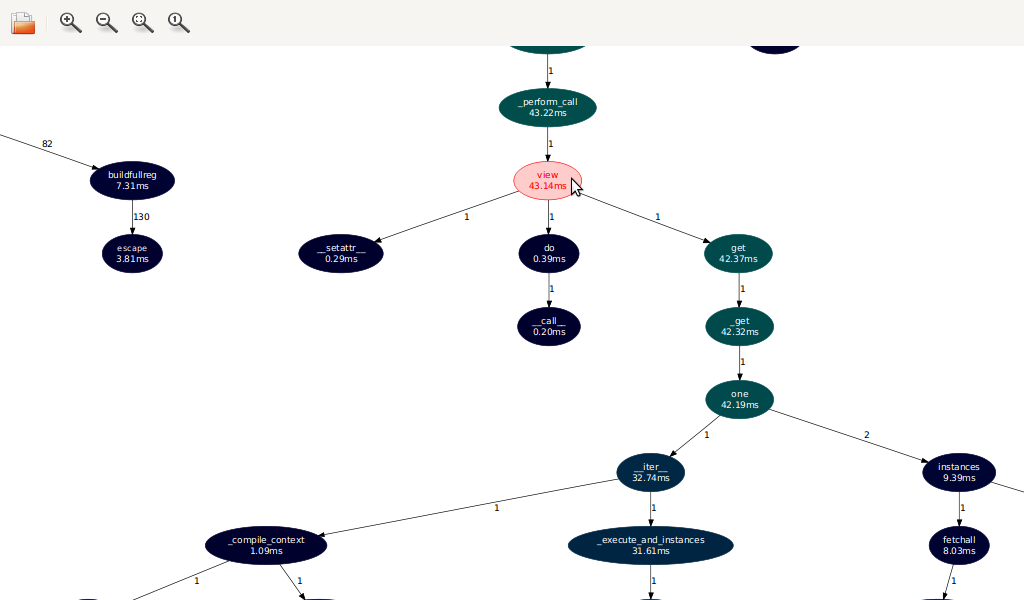
The actual controller action is called a bit further down:

Here it is, highlighted. 42 ms (24% total time), almost all of which is
spent in SQLAlchemy, loading the model object (a 2515 byte image stored as a
blob) from SQLite.
A mystery: pickle errors
When I first tried to play with the Dozer profiler, I was attacked by
innumerable exceptions. Some of those were due to a lack of configuration
(profile_path) or invalid configuration (directory not existing), or not
knowing the right URL (going to /_profiler raised TypeError). I
tried to make Dozer's profiler more forgiving or at least produce clearer
error messages in my fork branch,
e.g. going to /_profiler now displays the profile list.
However some errors were very mysterious: some pickles, written by Dozer
itself, could not be unpickled. I added a try/except that put those at the end
of the list, so you can see and delete them.
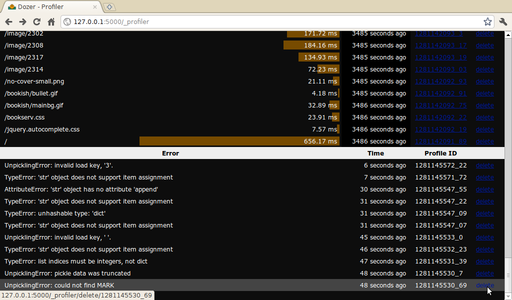
Does anybody have any clues as to why profile.py
might be writing out broken pickles?
Update: as Ben says in the comments, my changes have
been accepted upstream. Yay!