Yesterday I slashed 50% of run time from our applications functional test suite by modifying a single function. I had no idea that function was responsible for 50% of the run time until I started profiling.
Profiling a Python program is getting easier and easier:
$ python -m cProfile -o prof.data bin/test -f
runs our test runner (which is a Python script) under the profiler and stores the results in prof.data.
$ runsnake prof.data
launches the RunSnakeRun profile viewer, which displays the results visually:
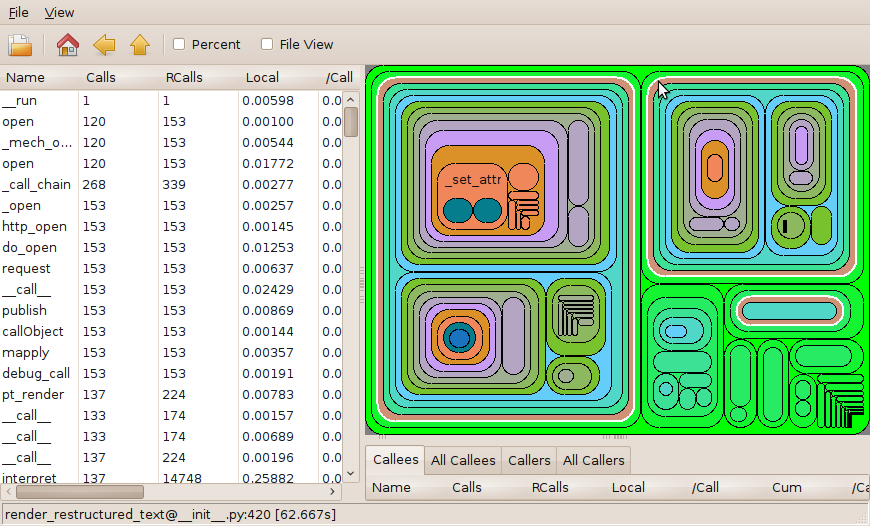
The square map display of RunSnakeRun, with the 'render_restructured_text'
function highlighted.
Who knew that ReStructuredText rendering could be such a time waster? A short caching decorator and the test suite is twice as fast. The whole exercise took me less than an hour. I should've done it sooner.
Other neat tools:
- pstats from the standard library lets you load and display profiler results from the command line (try python -m pstats prof.data).
- pyprof2calltree converts Python profiler data files to a format that the popular profiler visualization tool kcachegrind can understand. It's somewhat less useful now that RunSnakeRun exists.
- profilehooks by yours truly has decorators for easily profiling individual functions instead of entire scripts.
- keas.profile and repoze.profile hook up the profiler as WSGI middleware for easy profiling of web apps.