At work the functional test suite of our application used up quite a lot of RAM (over 500 megs). For a long time it was cheaper to buy the developers an extra gig of RAM than to spend time hunting down a possible memory leak, but finally curiosity overcame me and I started investigating.
Warning: long post ahead. With pictures.
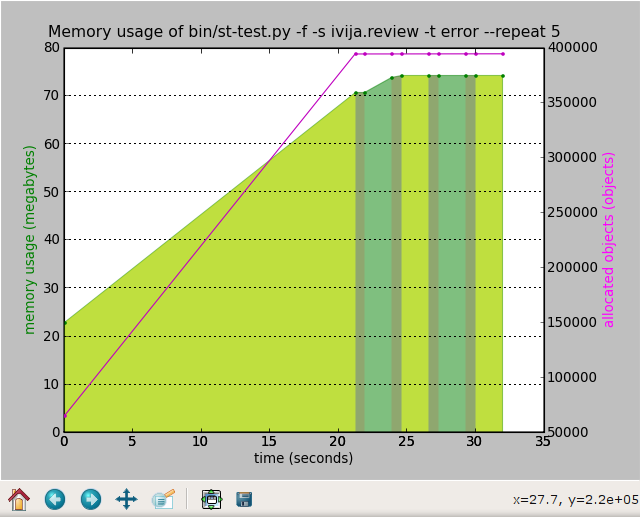
Running a subset of the tests in a loop quickly proved that the memory leak is real:
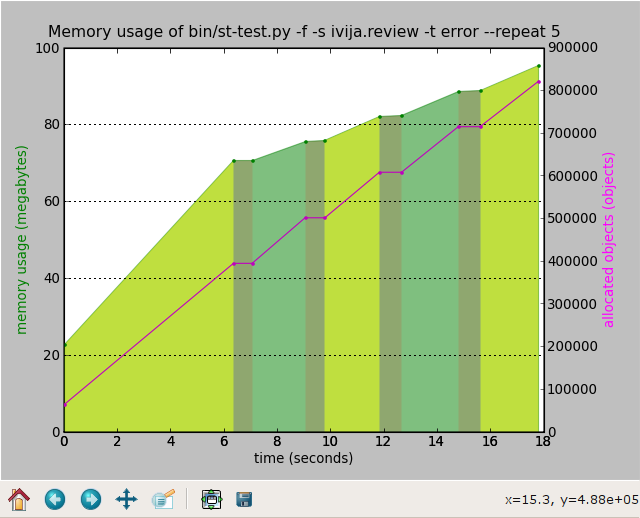
The graph was produced by instrumenting the test runner to record the timestamp, memory usage (VmSize from /proc/$pid/status) and the number of objects being tracked by the garbage collector (len(gc.get_objects()) in a CSV file, and then writing a simple Python program to plot it with matplotlib.
I love matplotlib for the ease of use, even though sometimes I wish the docs were a bit nicer.
But wait!, I hear you say, Python is a garbage-collected language! How can it leak memory?
I'm glad you asked. The trouble is that sometimes an object created by the test is referenced from a global variable, and that keeps it from being collected. The tricky thing is to find where that reference comes from, and what is the object being referenced. There are 800 thousand live objects, how do you find the offending ones?
It took quite a while to think of a solution. Finally my coworker Ignas suggested drawing object graphs with graphviz, and I developed a module with a few convenient helper functions.
I put a breakpoint at the very end of the app and started looking around. Here's the number of in-memory object databases:
(Pdb) checks.count('DB')
6
There shouldn't be any, or there should be at most one (a global in-memory RAM database used for tracking browser sessions or something like that)! Let's see what objects are pointing to the last one, limiting the referencing chains to 15 objects:
(Pdb) checks.show_backrefs(checks.by_type('DB')[-1])
Graph written to objects.dot (185 nodes)
Image generated as objects.png
The image produces is nice, but large (9760 x 8008 pixels), so I'm not going to show it here in full. Here's a shrunken version:
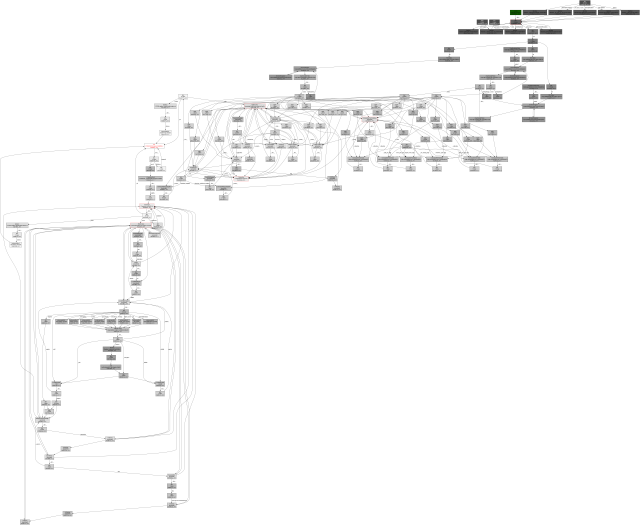
By the way, GIMP eats up a gig of RAM with it open.
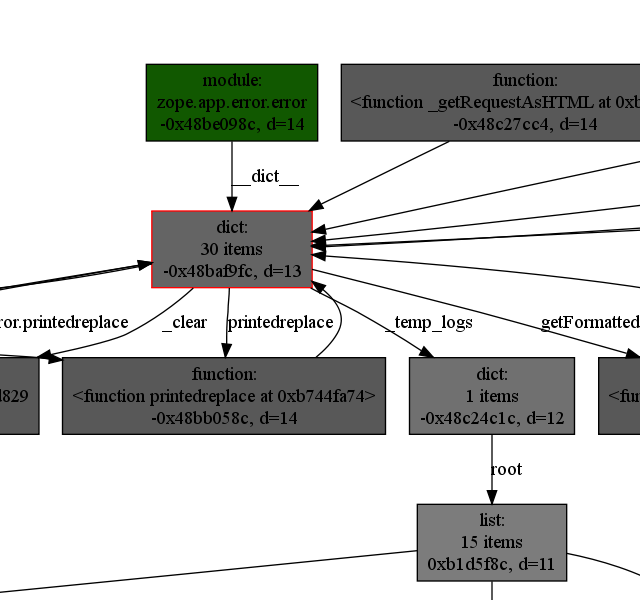
If you could zoom in and pan around, and if you knew the colour code, you'd immediatelly notice the green box indicating a module in the top-right corner:
Let me show you just the reference chain:
(Pdb) import inspect
(Pdb) chain = checks.find_backref_chain(checks.by_type('DB')[-1], inspect.ismodule)
(Pdb) in_chain = lambda x, ids=set(map(id, chain)): id(x) in ids
(Pdb) checks.show_backrefs(chain[-1], len(chain), filter=in_chain)
Graph written to objects.dot (15 nodes)
Image generated as objects.png
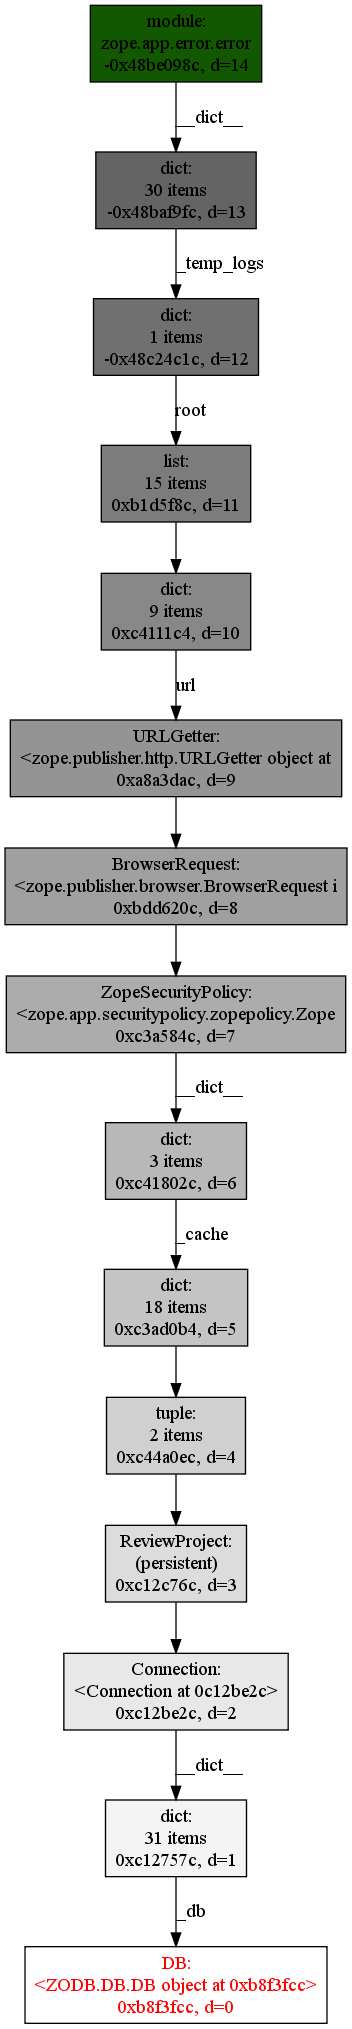
To get rid of this leak I had to clear zope.app.error.error._temp_logs in the test tear-down by calling zope.app.error.error._clear():
I attribute the slight memory increase on the second repetition to memory fragmentation: new objects are allocated, old objects are freed, the total number of objects stays the same, but now there are some gaps in the memory arena. This effect disappears on the third and later repetitions, so I'm not worrying.
There were a couple of other, smaller memory leaks elsewhere. At the end of the day the full test suite fit in under 200 megs of RAM.
Don't let anyone tell you that graph theory is useless in the real world. Also, Python's garbage collector's introspection powers are awesome!
Update: see the annotated source code for the 'checks' module.
Update 2: the 'checks' module was open-sourced as objgraph.