Our Zope 3 application had a speed problem: a view used to export an XML file with user data stored in the ZODB took two thirds of an hour. Clearly, the time to optimize it has arrived.
I've been indoctrinated by reading various sources (Federico Mena-Quintero's blog is a good one) that you must do two things before you start fiddling with the code:
- Create a reproducible benchmark
- Profile
Step one: benchmark. A coworker convinced me to reuse the unit/functional test infrastructure. I've decided that benchmarks will be functional doctests named benchmark-*.txt. In order to not clutter (and slow down) the usual test run, I've changed the test collector to demote benchmarks to a lower level, so they're only run if you pass the --all (or --level 10) option to the test runner. Filtering out the regular tests to get only the benchmarks is also easy: test.py -f --all . benchmark.
Next, the measurement itself. Part of the doctest is used to prepare for the benchmark (e.g. create a 1000 random users in the system, with a fixed random seed to keep it repeatable). The benchmark itself is enclosed in function calls like this:
>>> benchmark.start('export view (1000 users)')
...
>>> benchmark.stop()
The result is appended to a text file (benchmarks.txt in the current directory) as a single line:
export view (1000 users), 45.95
where 45.95 is the number of CPU seconds (measured with time.clock) between start/stop calls.
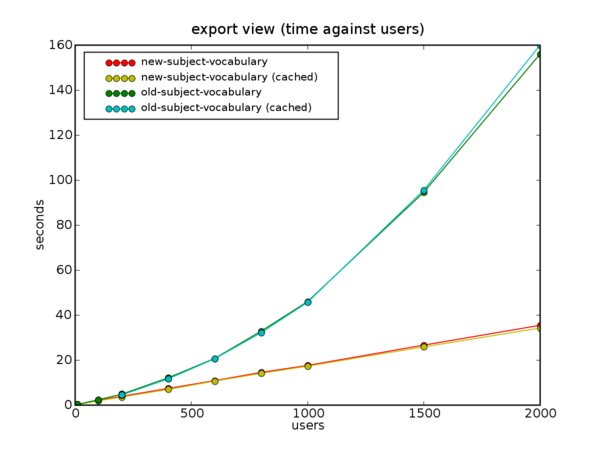
Next, I experimented with various numbers of users (from 10 to 2000) and recorded the running times:
export view (10 users), 0.25
export view (10 users), 0.26
export view (100 users), 2.33
export view (200 users), 4.81
export view (200 users, cached), 4.47
export view (200 users), 4.91
...
export view (2000 users), 155.96
export view (2000 users, cached), 159.91
The "cached" entries are from the same doctest run, with the benchmark repeated a second time, to see whether ZODB caches have any effect (didn't expect any, as functional tests use an in-memory storage, and besides all the objects were created in the same thread).
Clearly, the run time grows nonlinearly. Some fiddling with Gnumeric (somewhat obstructed by Ubuntu bug 45341) showed a pretty clear N**2 curve. However it is not fun to copy and paste the numbers manually into a speeadsheet. A couple of hours playing with matplotlib and cursing broken package dependencies, and I have a 109 line Python script that plots the results and shows the same curve.
Step two: profiling. (Well, actually, I did the profiling bit first, but at least I refrained from changing the code until I got the benchmark. And it would have been easier to profile if I had the benchmark in place and didn't need to do it manually. For the purposes of this narrative pretend that I did the right thing and created a benchmark first.)
A long time ago I was frustrated by the non-Pythonicity of the profile module (my definition of a Pythonic API is API that I can use repeatedly without having to go reread the documentation every single time) and wrote a @profile function decorator. This came in handy:
class ExportView(BrowserView):

    template = ViewPageTemplateFile('templates/export.pt')

    @profile
    def __call__(self):
        return self.template()
One run and I see that 80% of the time is spent in a single function, SubjectVocabulary (users are called subjects internally, for historical reasons). It is registered as a vocabulary factory and iterates through all the users of the system, creating a SimpleTerm for each and stuffing all of those into a SimpleVocabulary. It was very simple and worked quite well until now. Well, now it's being called once per user (to convert the value of a Choice schema field into a user name), which results in O(N2) behavior of the export view.
A few minutes of coding, a set of new benchmarks, and here's the result: