Dozer is mostly known for its memory profiling capabilities, but the as-yet unreleased version has more:
Log capturing
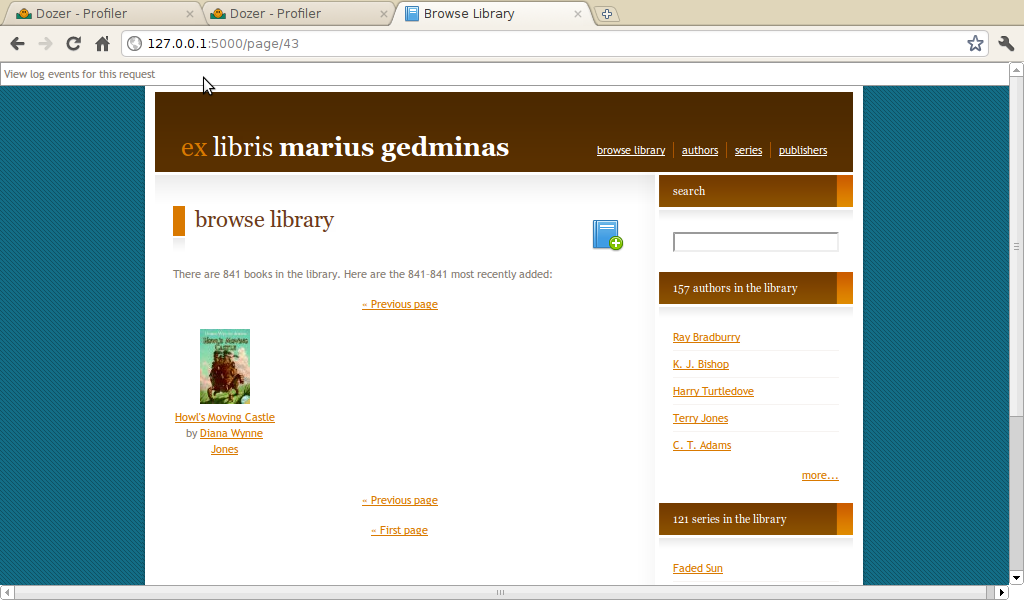
This WSGI middleware intercepts logging calls for every request. Here we see a toy Pylons application I've been working on in my spare time. Dozer added an info bar at the top:
When you click on it, you get to see all the log messages produced for this request. I've set SQLAlchemy's loglevel to INFO in my development.ini, which produces:
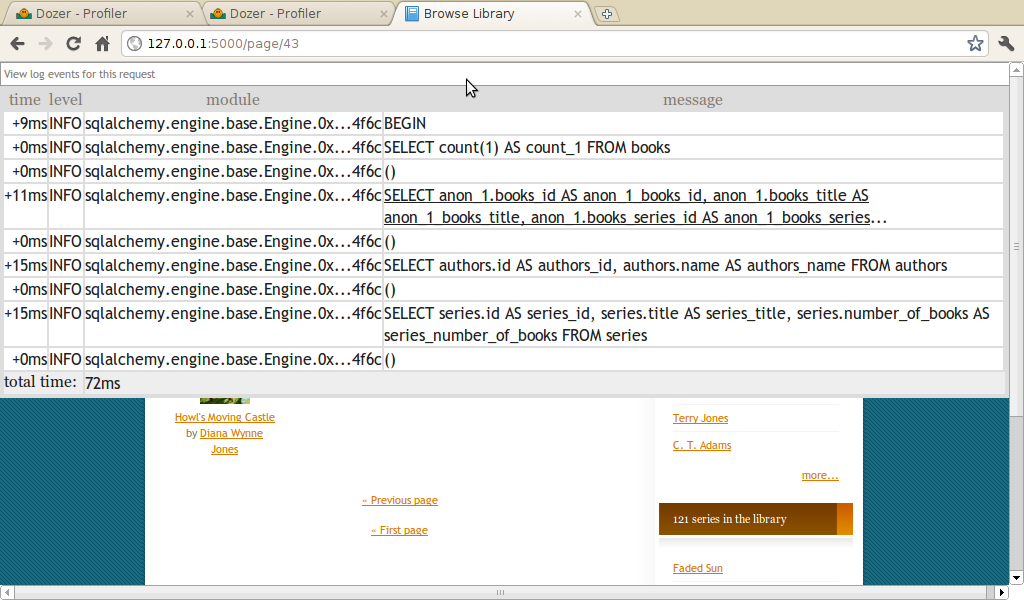
(Why on Earth does SQLAlchemy think I want to see the memory address of the Engine object in my log files, I don't know. The parentheses contain argument values for parametrized queries, of which there are none on this page.)
Upstream version displays absolute timestamps (of the YYYY-MM-DD HH:MM:SS.ssssss variety) in the first column; my fork shows deltas in milliseconds. The incantation in development.ini is
[filter-app:logview]
use = egg:Dozer#logview
next = main
which makes it disabled by default. To enable, you run paster like this:
$ paster serve development.ini -n logview
(Upstream version lacks the paste entry point for logview; it's in my fork, for which I submitted a pull request weeks ago like a good open-source citizen. Incidentally, patches for stuff I maintain have been known to languish for years in my inbox, so I'm not one to throw stones.)
Next: profiling with Dozer.
Update: Tom Longson blogged about this back in 2008! And his CSS is prettier.